MetricsThe numbers that run the business
Track any KPI, then segment it down to the property behind the event. Ask for one in plain English and it is built, saved and refreshing.
For E-commerce
This runs on your own data in under a minute.
A metric is a sentence, not a query.
Pick what you are counting, chain the events, add a condition, split it by anything. The name writes itself and the preview runs on sample data, so authoring costs nothing.
Preview runs on sample data while you write, so authoring costs no queries. Testing against your own data is one query, on demand.
Build your first metric on your own events.
What it is good for
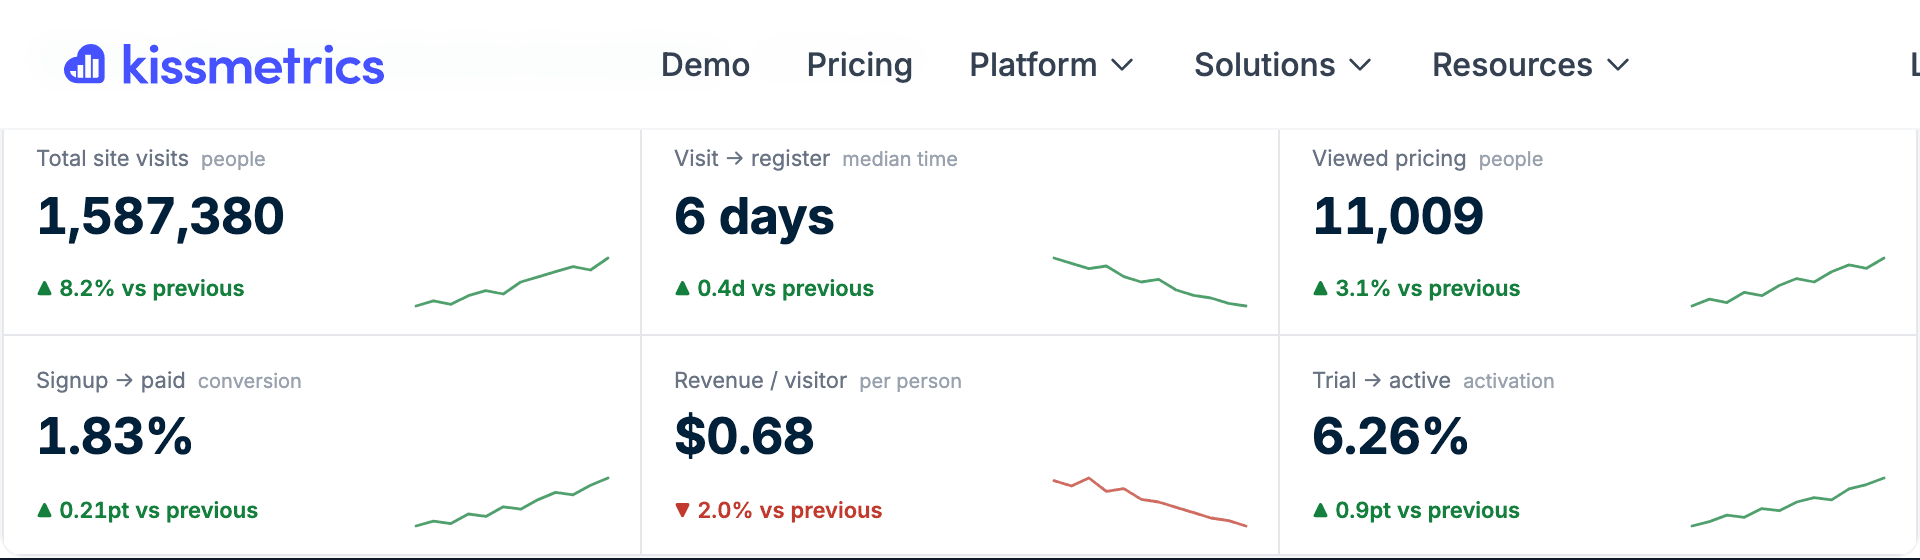
A metric is the number you would put on a wall. Kissmetrics builds them from your own events, so a metric is never an estimate from somebody else’s aggregate. Every one can be split by any property you track, which is what turns "signups are up" into "signups are up because organic is up, and paid is flat".
- Putting a single, agreed number behind each part of the business
- Splitting any number by channel, plan, device or country without rebuilding it
- Watching a KPI move week over week against the prior period
- Saving a metric once and reusing it as a dashboard widget
How different businesses use metrics
The report is the same. What changes is the question you point it at.
E-commerce
Trade a dashboard of vanity traffic numbers for the four that decide the quarter.
Orders, cart to order, revenue per visitor, repeat rate, each split by channel.
You see whether a bad week is traffic, conversion, or basket size, before you spend on fixing the wrong one.
Give it your URL. It does the rest.
Free to start, no card. Tracking, attribution and your first dashboard in under a minute.
Want a hand? Get a live demo