PRODUCT / REPORTS
Reports That Answer Business Questions
Nine powerful report types to slice your data any way you need. From funnels to cohorts to custom SQL - get the answers that drive decisions.
Why KISSmetrics Reports Matter
Your business has unique questions. You need tools that can answer them.
Start With Questions, Not Dashboards
Most analytics tools give you charts and hope you find something useful. KISSmetrics reports are built to answer specific business questions.
One Tool, Infinite Perspectives
Nine report types let you examine the same data from different angles. Understand not just what happened, but why - and what to do about it.
From Overview to Individual
Zoom out to see trends across thousands of users, then drill down to see exactly what a specific person did. Full context at every level.
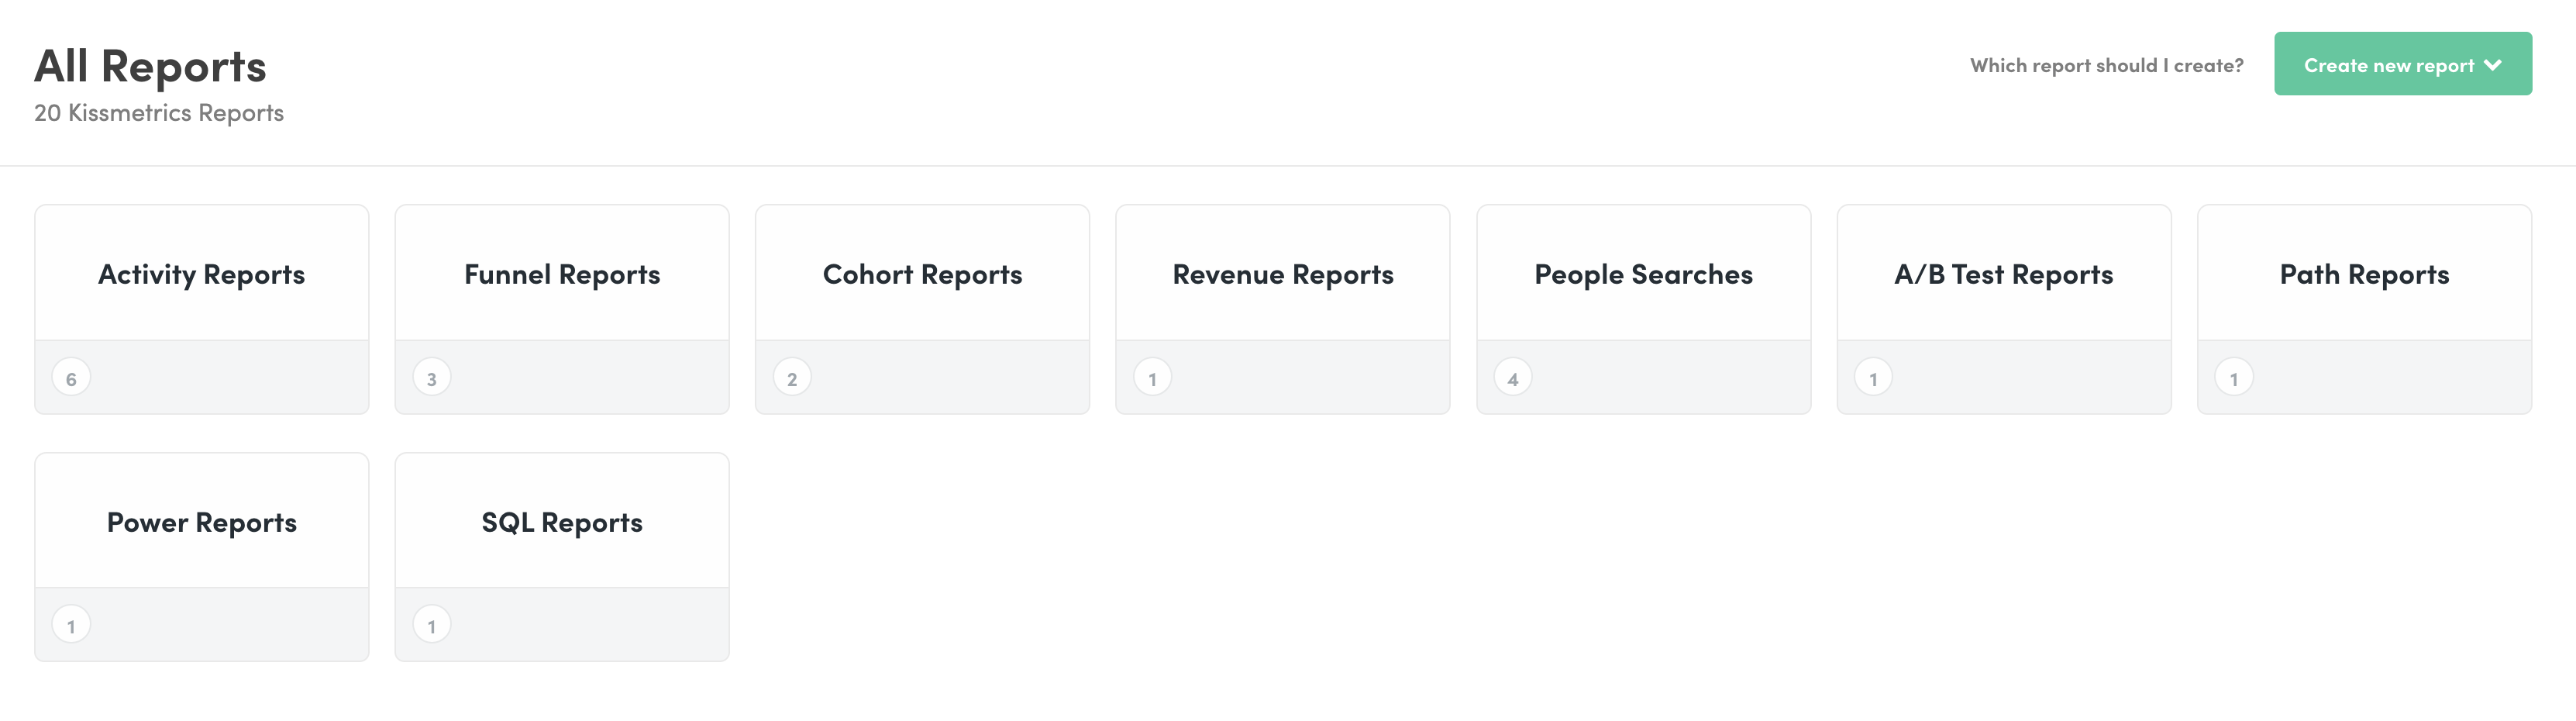
9 Report Types for Every Question
Click any report to learn more about its capabilities and how it can drive insights for your business.
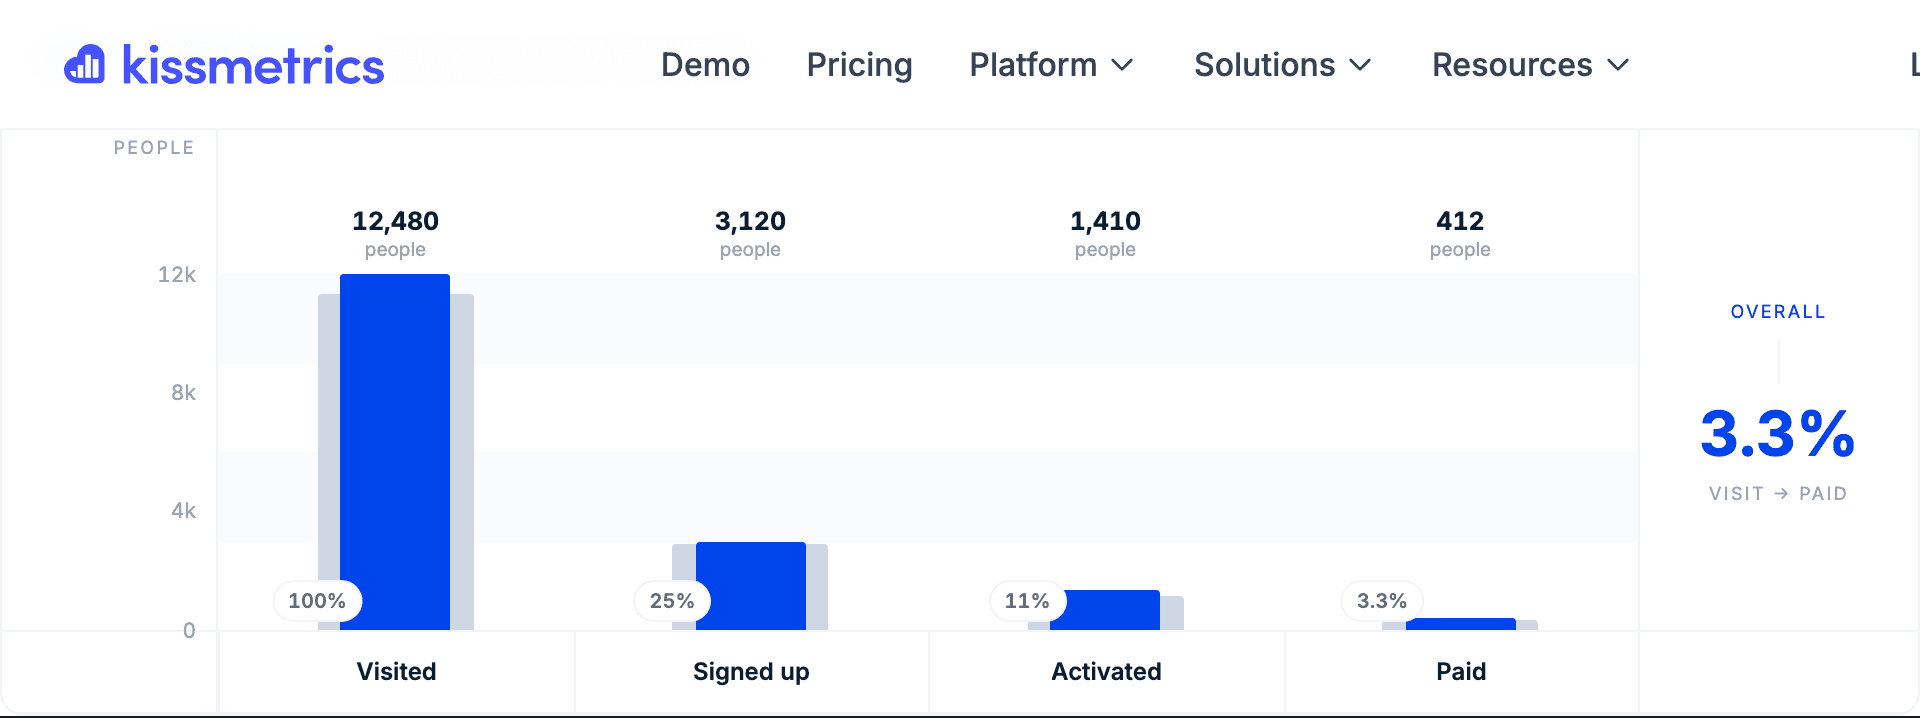
Funnel Report
Find where users drop off
Track user progression through sequential steps and identify exactly where conversions break down.
Cohort Report
Track retention over time
See how groups of users behave over time based on when they first performed an action.
Revenue Report
Follow the money
Analyze revenue attribution and track where your money actually comes from.
Activity Report
See engagement patterns
Track user engagement and activity over time with optional revenue breakdowns.
People Search
Find specific users
Search for users who share common characteristics - events, properties, or any criteria you define.
A/B Test Report
Measure experiment impact
Get statistical analysis of your experiments with confidence metrics that tell you when you have a winner.
Path Report
Discover user journeys
Visualize the most common sequences of actions that lead to conversions.
LLM Acquisition Report
See who arrives from AI assistants
Count the real people who reach you through ChatGPT, Perplexity, Gemini and Claude, and measure what they do next.
Product Usage Report
See what your best users do differently
Compare feature usage between your best cohort and everyone else, so you know which features actually predict success.
Quick Reference: Which Report Do I Need?
Match your question to the right report type.
| If you want to know... | Use this report |
|---|---|
| Where do users drop off in my signup flow? | Funnel Report |
| Do users come back after their first purchase? | Cohort Report |
| Which marketing channel drives the most revenue? | Revenue Report |
| How engaged are my users this month vs last? | Activity Report |
| Who are my power users and how do I reach them? | People Search |
| Did my new landing page actually improve conversion? | A/B Test Report |
| What sequence of actions leads to conversion? | Path Report |
| What do my best users do that everyone else does not? | Product Usage |
| Is ChatGPT sending me anyone worth having? | LLM Acquisition |
Reports that drive real business outcomes
Teams using KISSmetrics Reports uncover insights that lead to higher conversions, lower churn, and faster growth.
Get answers to your business questions
Free forever. 100k events a month, no credit card.