RevenueConnect behaviour to dollars
Tie recurring revenue, new revenue and ARPU back to the behaviour that produced them, on the same event store as every other report.
For SaaS
This runs on your own data in under a minute.
What it is good for
Revenue reported on its own tells you what happened. Revenue tied to behaviour tells you why. Because the money events sit in the same stream as everything else, you can move from an MRR line to the channel, cohort or feature behind it without exporting anything.
- Trending recurring revenue with new revenue against churn
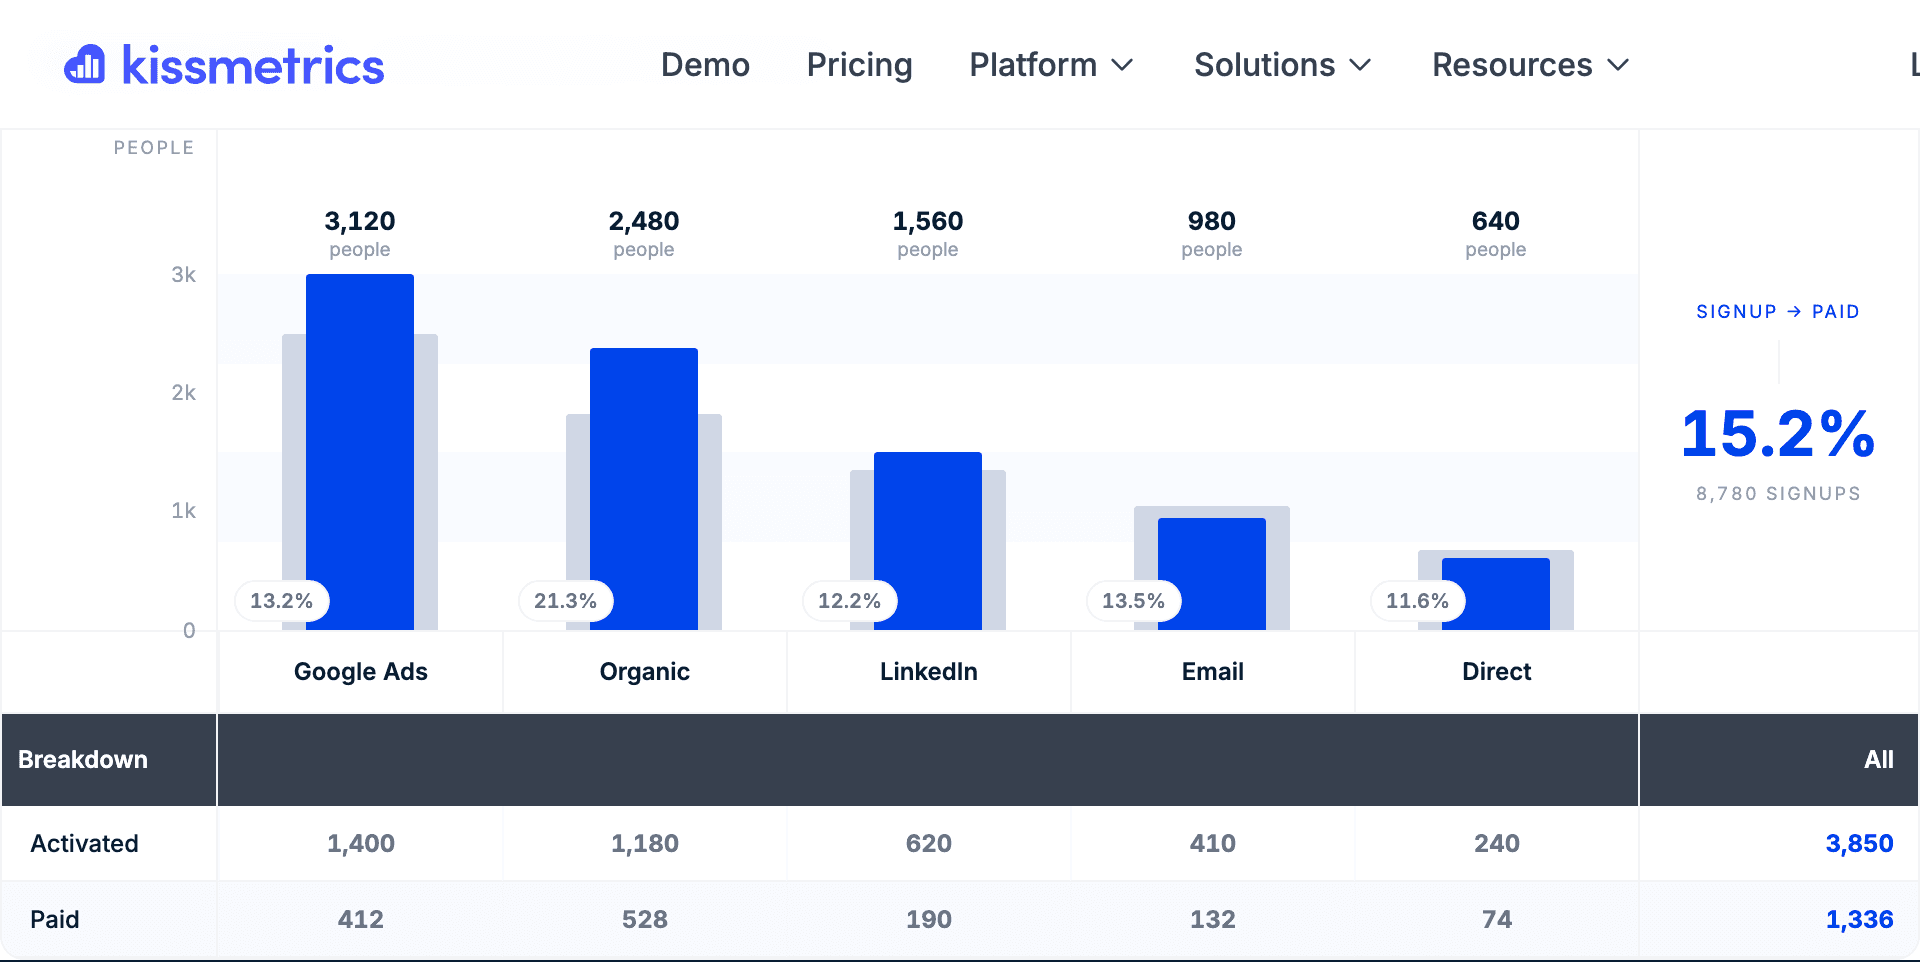
- Attributing revenue to the channel that acquired the person
- Comparing ARPU across plans, cohorts and channels
- Finding the behaviour that precedes an expansion
How different businesses use revenue
The report is the same. What changes is the question you point it at.
SaaS
Read MRR, new revenue and churn on one line, then split by acquisition channel.
Revenue events mapped to signup, trial, purchase and cancel, trended weekly.
You spend on the channel that produces revenue rather than the one that produces volume.
Give it your URL. It does the rest.
Free to start, no card. Tracking, attribution and your first dashboard in under a minute.
Want a hand? Get a live demo